List of Key Plots
The Key Plots that demonstrate the tomographic 3x2pt power spectrum constraints on Dark Energy are presented in Wong et al. 2025 (https://arxiv.org/abs/2501.07559)
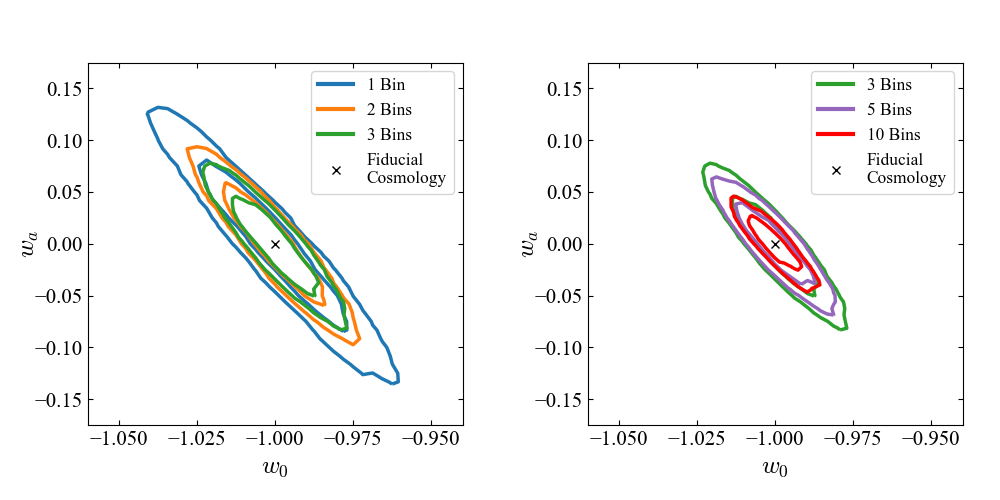
Figure 6) Tomographic shear constraints on w0-wa for different numbers of equipopulated bins. Run by setting
ZBIN_TYPE=EQUI_POP,OBS_TYPE=1X2PT,FIELD=Ein thepcl_measurementroutine.
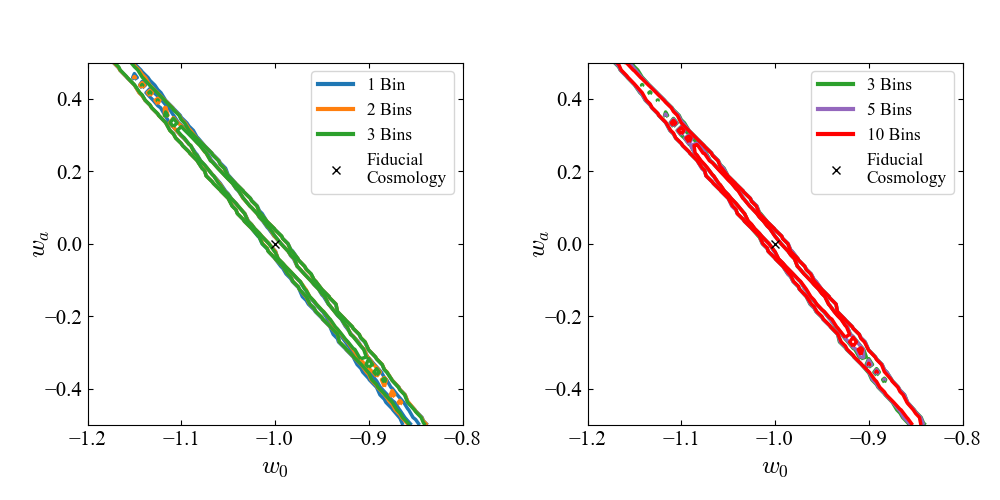
Figure 8) Tomographic angular clustering constraints on w0-wa for different numbers of equipopulated bins. Run by setting
ZBIN_TYPE=EQUI_POP,OBS_TYPE=1X2PT,FIELD=Nin thepcl_measurementroutine.
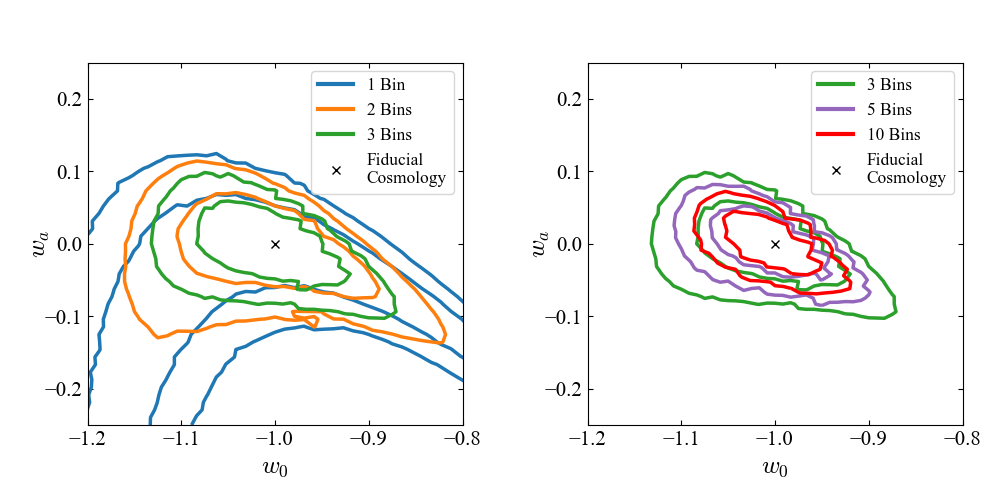
Figure 10) Tomographic shear constraints on w0-wa for different numbers of equipopulated bins. Run by setting
ZBIN_TYPE=EQUI_POP,OBS_TYPE=3X2PTin thepcl_measurementroutine.